Filebeat modules
Filebeat 内置提供了许多 开箱即用 的 modules (模块),对日志文件做简单的收集和解析处理,相比于直接使用 logstash 方便了很多。
提供如下功能:
- Filebeat input 配置。设置 log 文件的抓取路径,能根据不同系统设置不同路径。
- 提供 Elasticsearch Ingest Node pipeline definition。大概通过管道解析预处理元数据到 elasticsearch
- Fields 字段定义
- 简单的 Kibana dashboards 仪表盘示例和 visualize 图标分析
内置模块:
这篇的目的通过修改 Filebeat 内置模块 nginx,以适应业务访问日志分析。
修改 nginx modules
内置的 nginx modules 只是针对 nginx 的默认 log 格式,如下所示:
1 | http { |
但现实,我们的 nginx log 会包含更多字段,比如:请求的响应时间、爬虫打标、登录用户 Id 记录…
这里示范如何修改默认 nginx 配置来达到业务需求。
看下目前 nginx 日志格式
先来熟悉下目前 nginx 自定义设置的日志格式 format:
1 | http { |
在默认的日志格式上,简单做了取舍和顺序换位。也增加了业务上的字段,比如:用户 uid;爬虫标识 spider
实际日志输出(为方便对比,换行展示):
1 | 123.125.71.107 - - |
修改解析规则
修改 modules 默认引导文件 manifest.yml
可能 nginx 输出的 log 路径有所不同,需要修改日志读取目录路径;已经新定义 ingest 解析规则文件
1
vi /mydata/filebeat-6.7.1-linux-x86_64/module/nginx/access/manifest.yml
1
2
3
4
5
6
7
8
9var:
- name: paths
default:
# 如果你 nginx log 输出路径和默认不一致,需要修改
- /var/log/nginx/*access.log*
...
# 重新指定提取规则文件
# ingest_pipeline: ingest/default.json
ingest_pipeline: ingest/pro.json修改 ingest 规则文件
参照上一个修改,此处文件已经变更为 pro.json
1
vi /mydata/filebeat-6.7.1-linux-x86_64/module/nginx/access/ingest/pro.json
注意:patterns 为单行内容(为方便对比,换行展示)
1
2
3
4
5
6
7
8
9
10
11
12
13
14
15
16"grok": {
"field": "message",
"patterns": [
"\"?%{IP_LIST:nginx.access.remote_ip_list} %{IP_LIST:nginx.access.forward_ip_list} -
\\[%{HTTPDATE:nginx.access.time}\\] %{GREEDYDATA:nginx.access.info} %{NUMBER:nginx.access.response_code:long} %{NUMBER:nginx.access.body_sent.bytes:long} %{NUMBER:nginx.access.request_time:float}
(%{NUMBER:nginx.access.uid}|-)
%{GREEDYDATA:nginx.access.agent}
%{SPIDER:nginx.access.spider}"
],
"pattern_definitions": {
"IP_LIST": "%{IP}(\"?,?\\s*%{IP})*|-",
"SPIDER": "%{WORD}|-"
},
"ignore_missing": true
}
...基本是在原有基础上做字段的位置变更,和字段的添加,没有对配置文件 大改 (也怕改崩 :neutral_face:)
清空 elastisearch 相关内容(未了解,很佛系的操作)
主要作用是清除旧索引、模板等历史“缓存”数据
1
DELETE http://192.168.1.65:9201/_ingest/pipeline/*
1
DELETE http://192.168.1.65:9201/_template/*
重启 Filebeat ,读取新数据
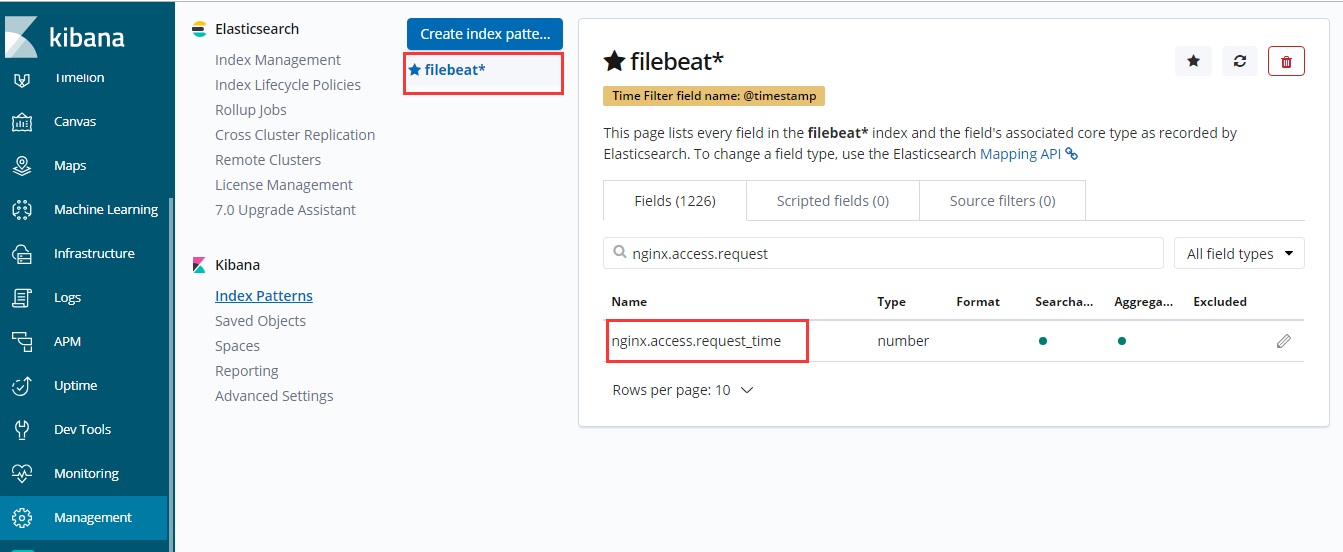
重建 Kibana Index 索引
如果你能搜索到你新添加的 Field 字段,恭喜你成功了。
如果失败,可能有如下原因:
- 参照步骤 4,可能还有其他数据需要删除
- 解析规则有问题,比如少个引号,少个空格之类
Dashboard 实际效果
成功添加字段后,可以在 Kibana 有更丰富的展示

左下角的耗时 pipe,根据 request_time 字段统计得出